A direct view of your results
Dashboards show in real time how your company is performing, and the AI assistant answers any question in seconds.
So you steer on facts.
Indispensable when you run several teams as a large removals firm.
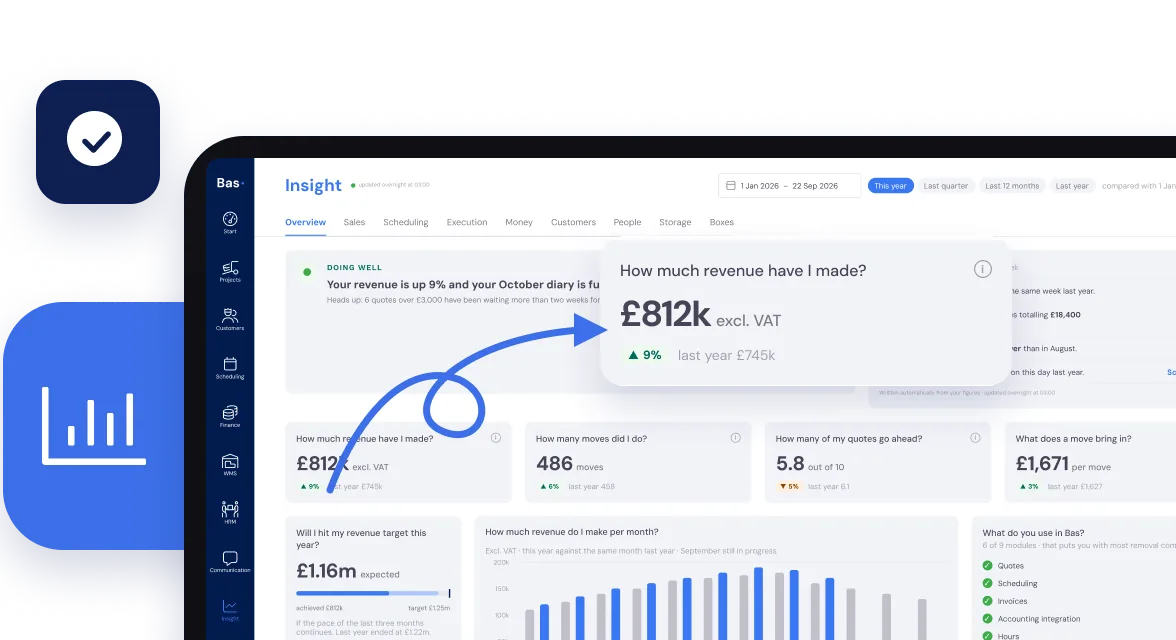
Insight into sales, planning and operations
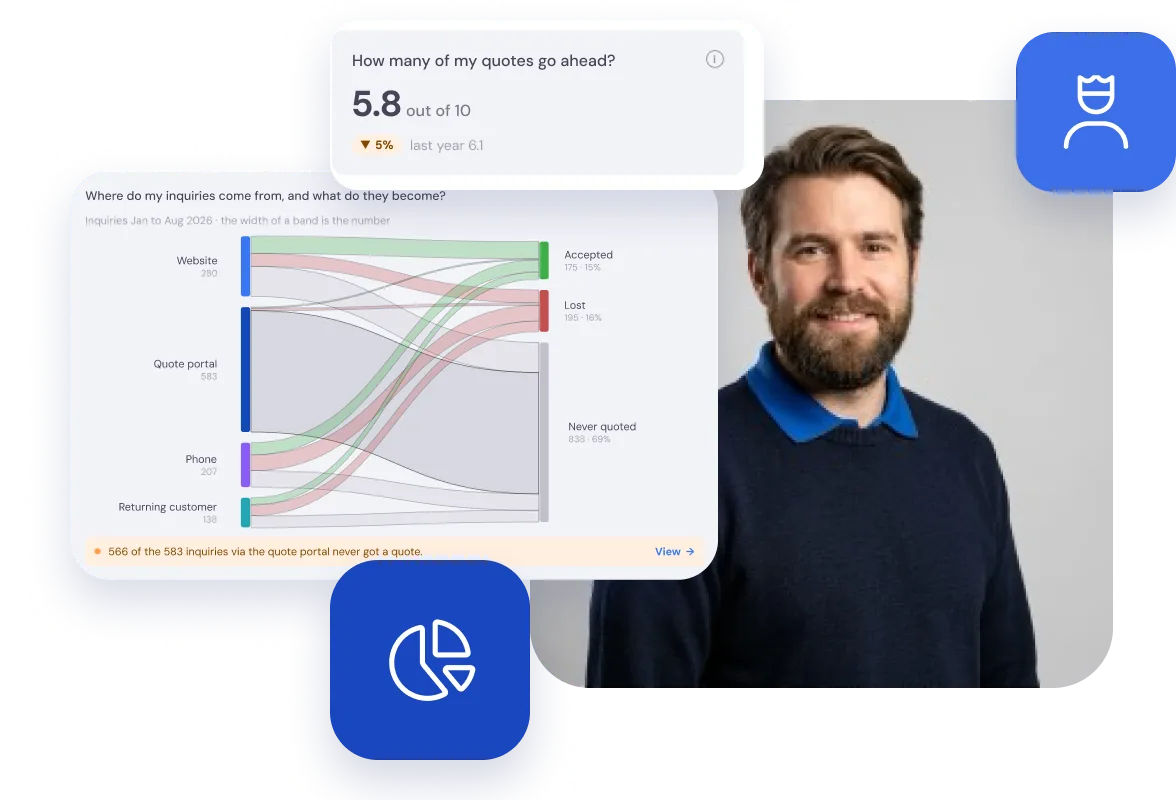
Grow your revenue
Gain insight into the success of your sales.
You see not only total sales per period, but also:
- the success of your lead channels
- sales, conversion rate and average deal value per location
- sales and conversion rate per price category
- sales and conversion rate per salesperson
This gives you enough information to steer towards more successful sales!
The figures come straight from your sales in Bas.
Optimise your operations
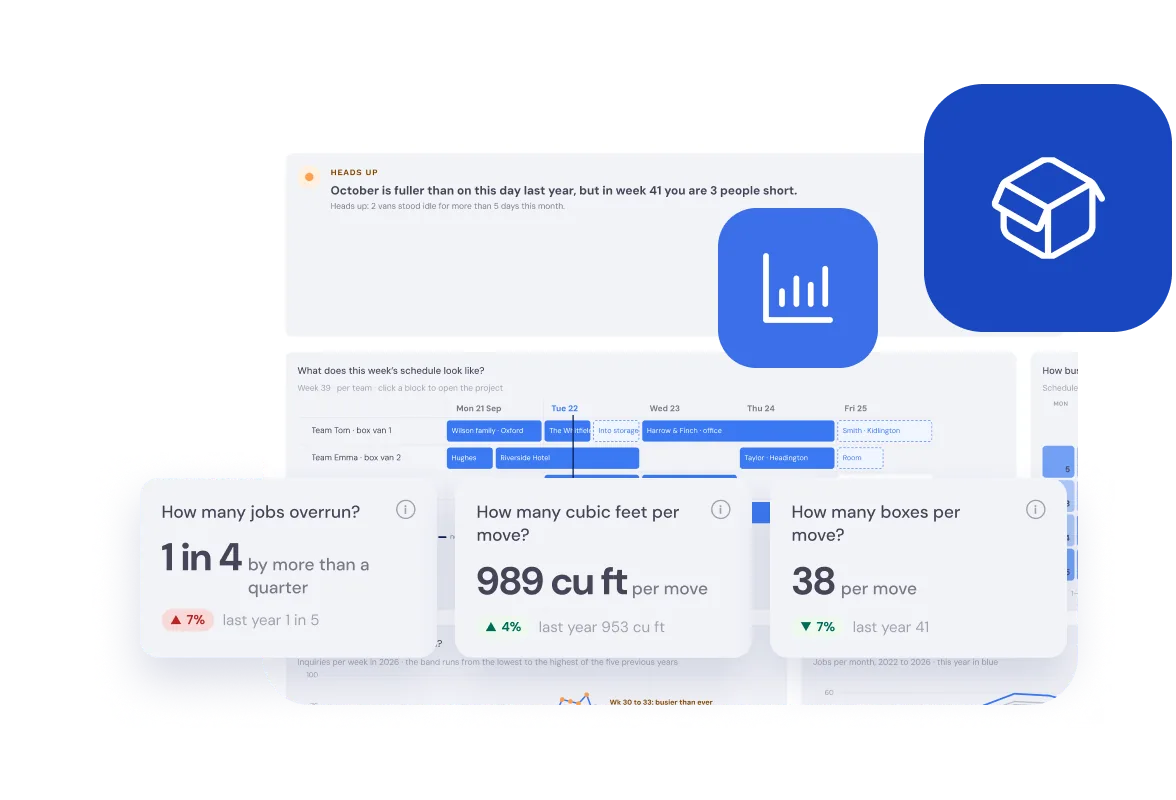
See how efficient your planning is.
Gain insight into the number of jobs and cubic metres that need to be planned and executed per period, with how many employees and which vehicles this needs to be done.
Based on this, you can determine whether the utilisation of your permanent staff, hired workers and vehicles is already optimal — or whether there is still room for improvement.
So you see what your planning really delivers.
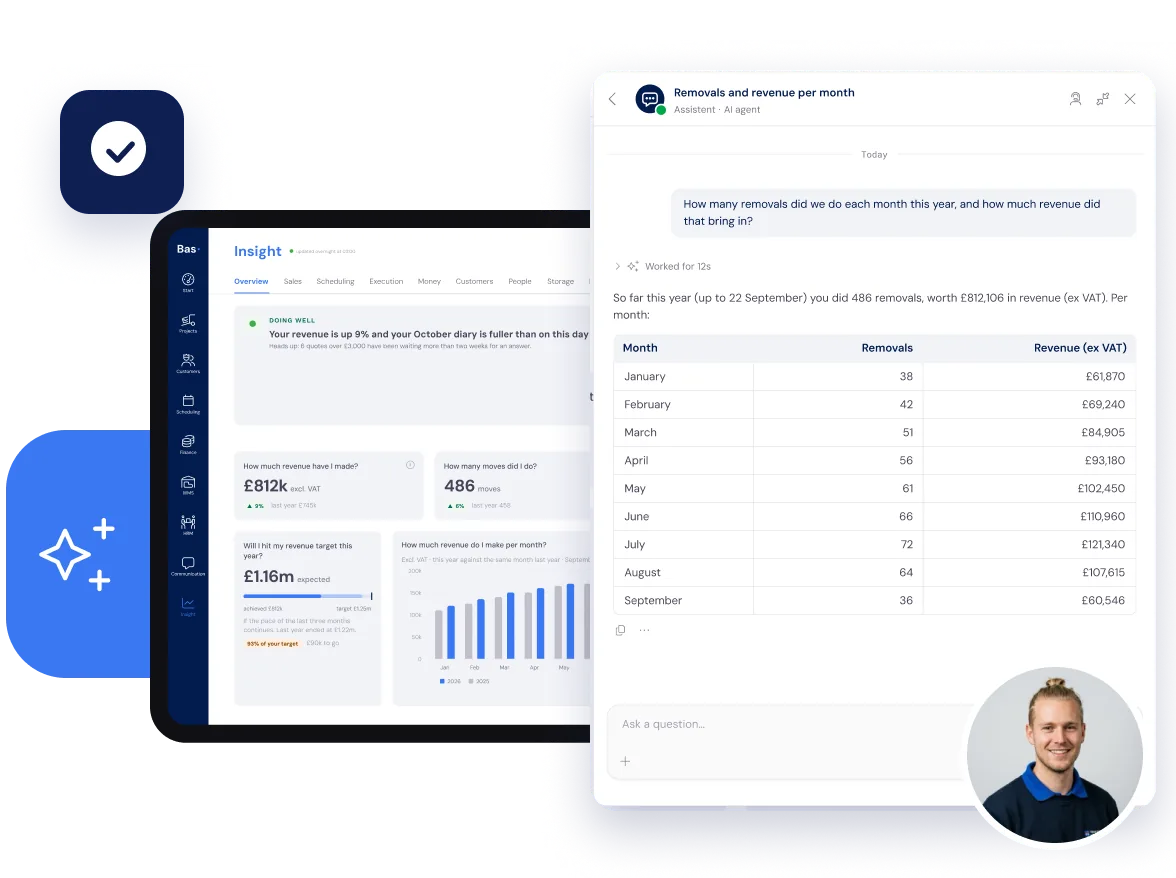
You ask the questions, the AI dives into the data and gives the real answer
Want to grow? Then you need control — not over averages, but over your own situation.
Our AI helps you find answers fast, deepen your insights and build exactly those reports that move your business forward.
Everything you need to know about your finances and HR
Control over staff costs
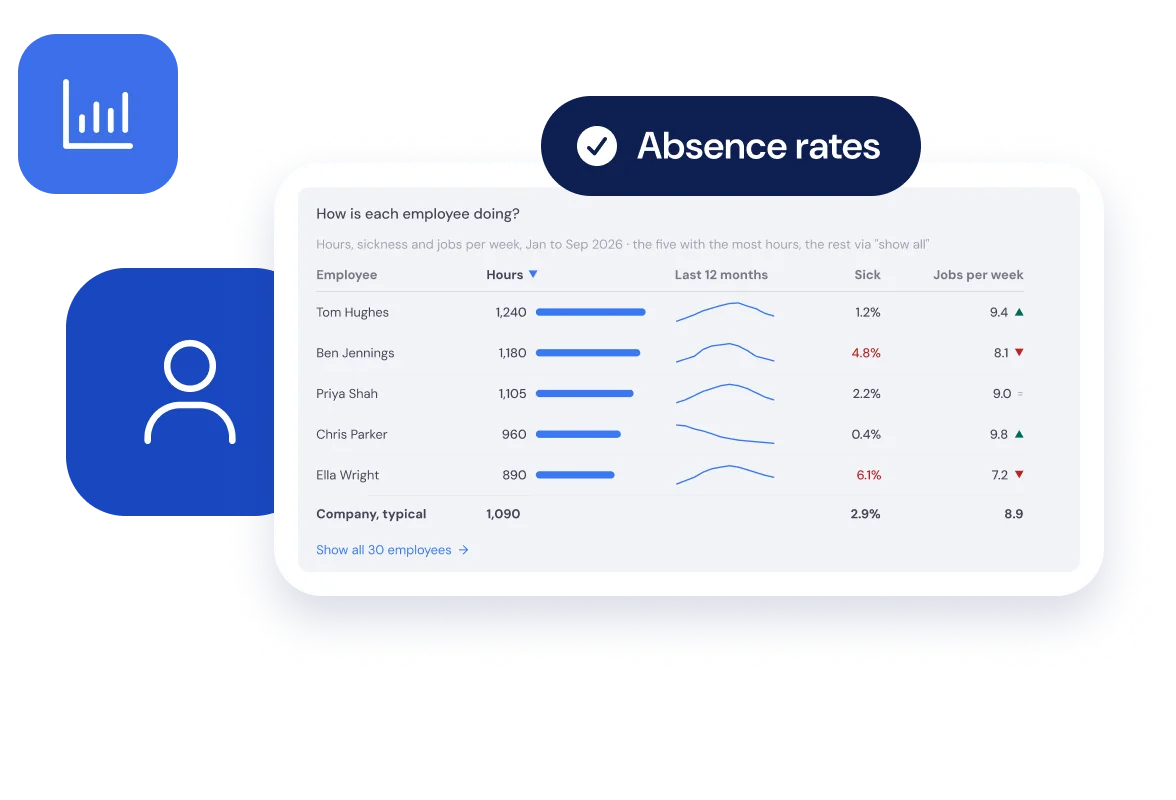
Gain insight into your HR with sickness absence figures for your company and per employee. Get insight into the skills of your staff.
The data comes from HRM: leave, sickness and hours.
Increase your income
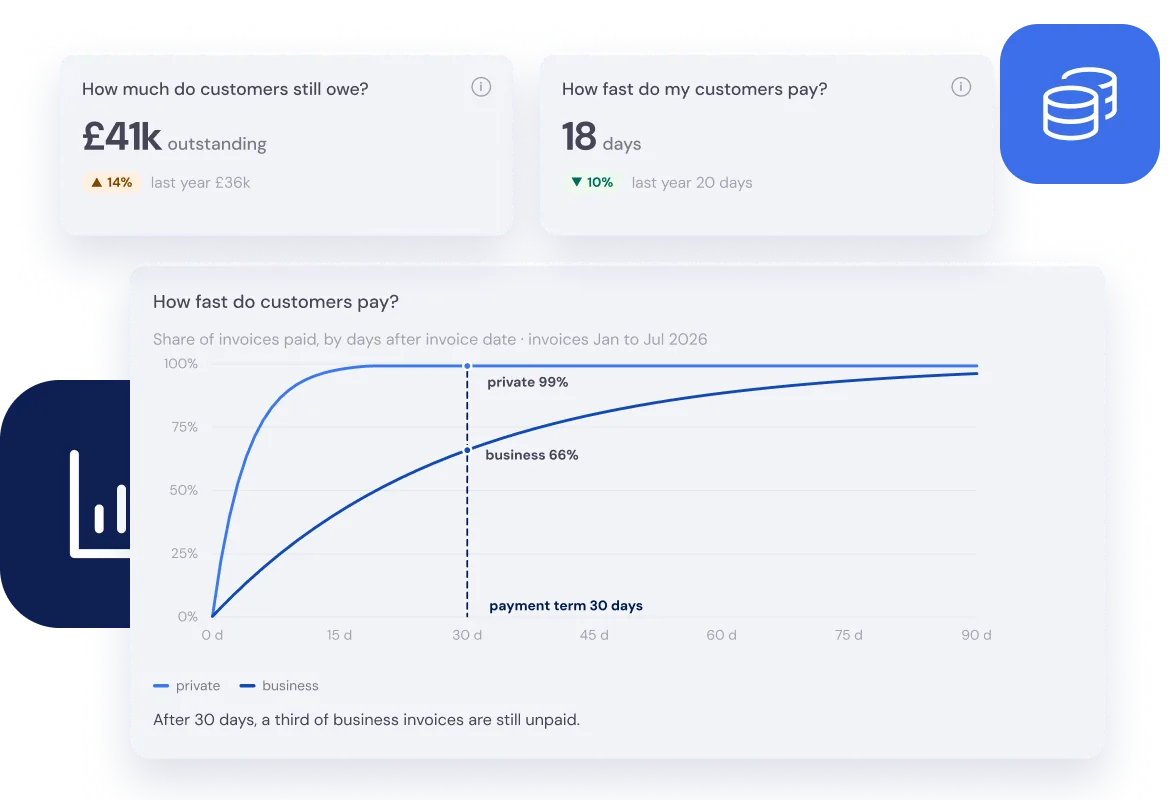
View the trends in your turnover, compare with last year and determine whether your revenue is heading in the right direction.
Gain insight into your debtors with the top 10 outstanding items, the development of payment terms and how you score compared to the benchmark.
All based on your invoices in Bas.
Frequently asked questions about insight
The questions moving companies ask us most often, with a short answer.
Bas offers dashboards for sales (leads, conversion rate, average deal value), planning (utilisation, capacity), staff (costs, sickness absence, skills) and finance (revenue, outstanding invoices, receivables management). You see year-on-year comparisons and can zoom in on a branch or an employee. Read more in Run your moving company with data: the numbers to check every week.
In Bas you can ask questions about your own business data through an AI interface. You type a question, such as 'How much revenue did I make per employee last quarter?', and Bas automatically produces a chart or a table with the answer. You need no knowledge of reports or formulas.
Bas shows an overview of your largest outstanding invoices, sorted by amount or by age. You see immediately who still has to pay and how long invoices have been open. Automatic payment reminders go out based on the payment term you have set per customer.