Monday morning, half past seven. The coffee is ready and the week begins. How did last week actually go? You have a feeling: busy, lots of enquiries, a few good jobs. But how many quotes actually turned into jobs? Is next week's planning full enough? And that business customer who still has to pay, how long has that been open?
A feeling is not wrong, but it tells you little about where to adjust. Running on data does not mean spending all day in charts. It means looking at a few numbers every week and knowing what you do with each one.
Why run a moving company on data?
Because most decisions in your company come down to the same few questions. Is enough work coming in? Can we handle it with the people and trucks we have? And is the money actually coming in? If you answer those questions with numbers every week, you see a dip coming before it hurts.
You do not have to collect the numbers yourself. If your quotes, planning, invoices and hours are in one system, they come out by themselves. In Bas you see them on the dashboards under Insight.
Which numbers do you check every week?
You do not have to track everything. These are the numbers that say the most for a moving company, each with the question you ask yourself.
1. How many quotes turn into jobs?
Your conversion rate is the first thing to look at. Do not just look at the total, but also per lead source and per salesperson. Does your website bring better customers than the quote sites? Does one salesperson score much better than another? Then you know where to put your money and attention. How to get more jobs from the same enquiries is explained in more jobs from the same enquiries.
2. Where and in which price range do you win?
Look at your sales per town and per price category. Maybe you win almost everything in your own region but little in the next city. Or you do well on small moves and lose the big ones. That tells you where to be visible, and where your price may be off.
3. How full is your planning?
Look at how many jobs and cubic metres are planned for the coming weeks, and with how many employees and vehicles. That shows whether your permanent crew and your hired help are well balanced, and whether you have room for that late enquiry. More on planning in planning software for moving companies.
4. Is your revenue heading the right way?
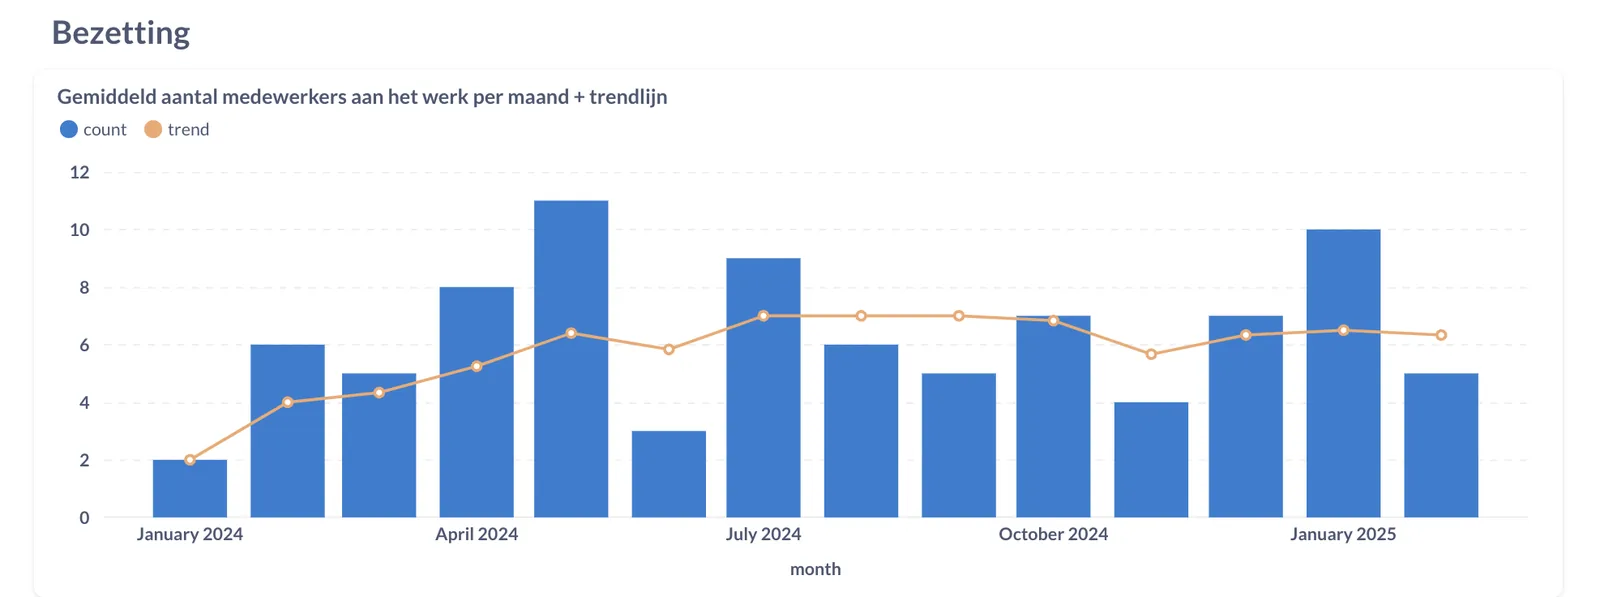
Compare your revenue with the same period last year, not with last month. Moving is seasonal work: a quiet January says nothing, a January that is much quieter than last year does.
5. How much is still open?
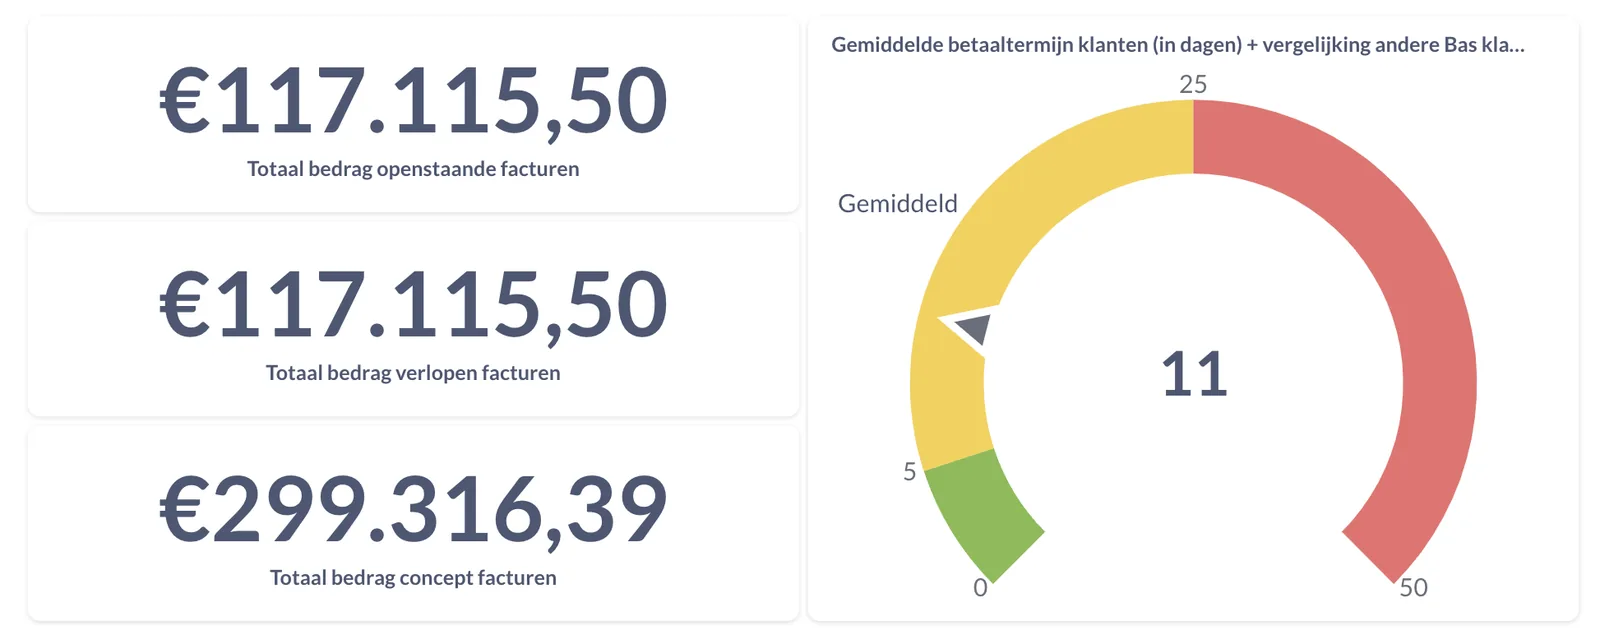
Look at your outstanding invoices and how long customers take to pay on average. A few large invoices that stay unpaid show up straight away in your cash. If you look every week, you call in time.
6. How are your people doing?
Sickness absence per employee shows patterns you would otherwise miss. Someone who is often off sick for short periods may be on the heaviest jobs too often. What your people really cost, we worked out in the real cost of a mover per hour.
A number is only valuable if you know what you do when it goes the wrong way. So start with three numbers you actually look at, instead of twenty you ignore.
How do you turn it into a habit?
Most companies start enthusiastically and stop after a few weeks. This helps you keep going:
- Pick a fixed moment. Monday morning, for example, fifteen minutes before the phone starts ringing.
- Start with three numbers. Conversion rate, planning and outstanding invoices. Only add more once this is a habit.
- Give every number an owner. The salesperson watches the quotes, the planner the occupancy. You look at the whole picture.
- Discuss it briefly with your team. Five minutes in the weekly meeting is enough. People work differently when they see what their work delivers.
- Look back after a month. What did you change, and did the number move the right way?
And if your question is not on the dashboard?
Then you just ask it. In Bas you type a question to your own numbers, for example how much revenue you made per employee last quarter, and Bas turns it into a chart or table. You do not need to know anything about reports or formulas. That way it stays about your questions, not about what a standard report happens to show.
Want to know which dashboards Bas includes? Have a look at Insight.
Shall we grab a coffee?
Let’s talk about which numbers say the most for your company.
Online or on location, you choose.