Dashboards and reports for removal companies
Monday morning, and you want to know whether last month was a good one. Usually that means a spreadsheet, the accounts and a fair bit of guesswork. Most removal companies only find out properly when the accountant rings.
In Bas, the figures come from the work you already do there: the quotes, the diary, the invoices and the timesheets. Open the dashboard and revenue, moves and quotes won are there in real time, each next to last year.
If you run several crews as a larger removal firm, this is where you see the whole business at once.
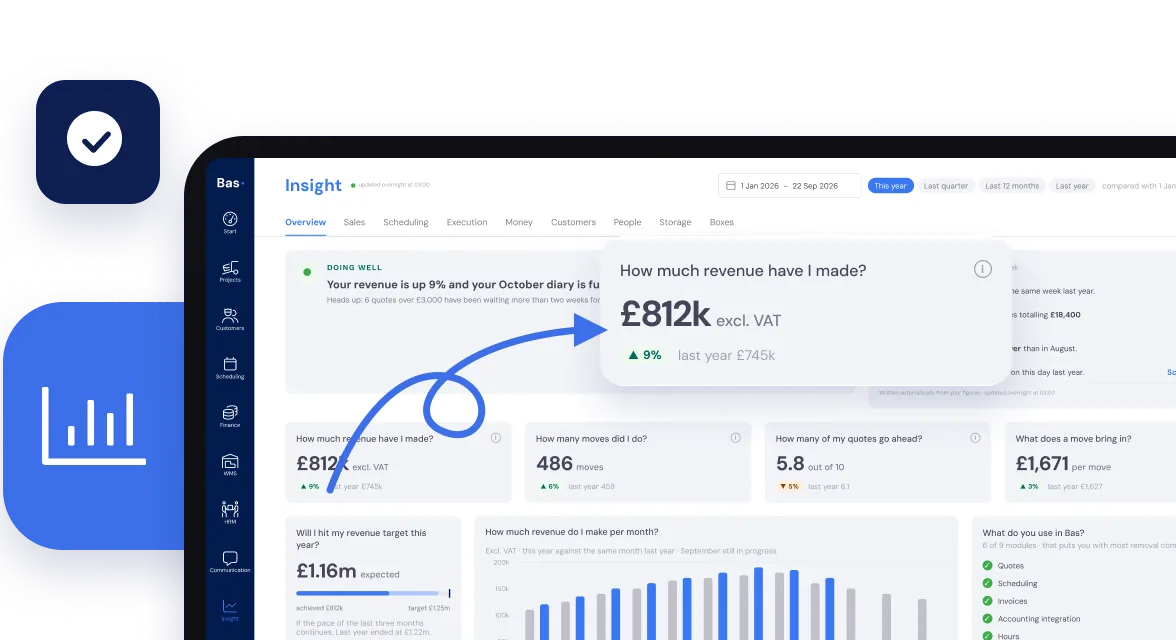
The figures were always there. They were just spread over the quote book, the diary and the bank statement.

Which enquiries turn into moves
You pay for enquiries every month. Bas shows what became of them: for each source, your website, a lead provider, the phone or a returning customer, how many got a quote, how many you won and how many you lost.
You also see how many quotes go ahead for each salesperson, each location and each price band, and the average value of a job.
The figures come straight from Sales.
How full the diary really is
For each period you see how many jobs and how many cubic feet there were to plan and carry out, and how many staff and vans it took. You see how often jobs overran, too.
From that you can tell whether your own staff, your agency staff and your vans are as busy as they should be, or whether there’s room for more.
The figures come from the Diary.

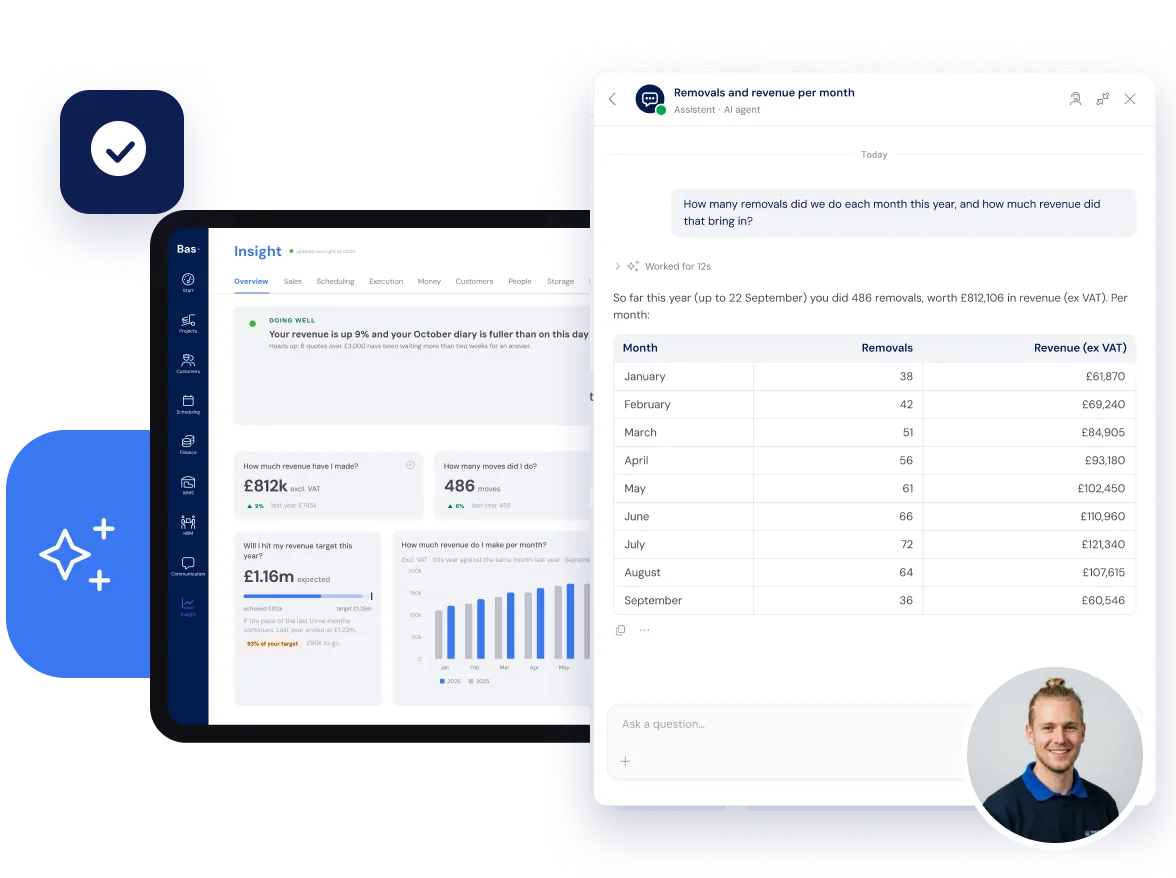
Ask a question the way you’d ask your accountant
Type “How many removals did we do each month this year, and how much revenue did that bring in?” and the AI assistant goes through your own figures and answers with a table or a chart.
No report builder, no formulas. If the answer raises another question, ask that one too.
A busy month in the diary doesn’t always mean a good month in the bank.
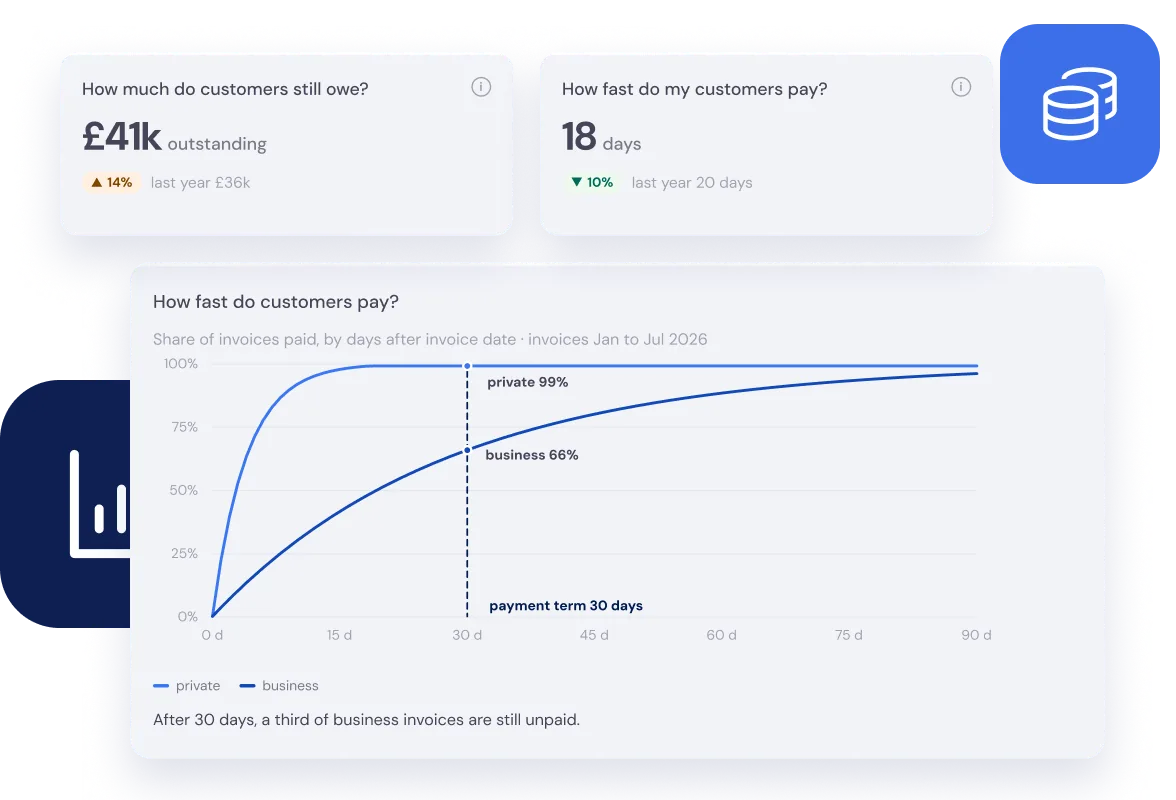
When the money is slow to come in
Follow your revenue over time and compare it with last year. For credit control you get the top 10 unpaid invoices, what customers still owe you and how long they take to pay, with domestic and commercial customers shown separately.
All of it comes from your invoices in Bas.
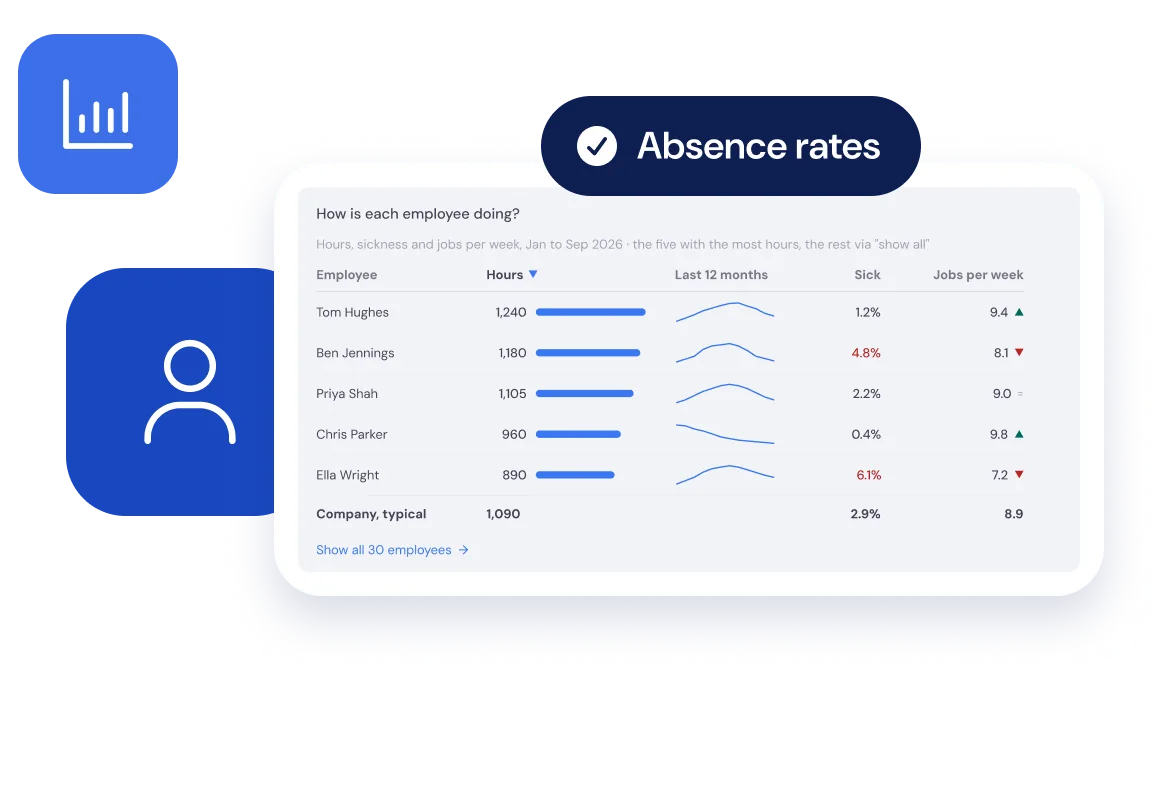
Hours and sickness for each member of staff
See the hours, sickness and jobs per week for every member of staff, and for the firm as a whole. You see which skills your staff have, too.
The figures come from HR: hours, holiday and sickness.
Questions about dashboards and reports
What removal companies ask us most, with a short answer to each.
Dashboards for sales (enquiries, quotes won, average job value), the diary (how busy your crews and vans are), staff (hours, sickness, skills) and money (revenue, unpaid invoices, credit control). You can compare one year with the last and look at a single location or member of staff. Read more in Run your removal company with data: the numbers to check every week.
No. The dashboards fill themselves from the work you already do in Bas: the quotes, the diary, the invoices and the timesheets. Nobody has to keep a spreadsheet alongside.
Yes. Type a question such as “How much revenue did each member of staff bring in last quarter?” and the AI assistant answers from your own figures with a chart or a table. You don’t need to know anything about reports or formulas.
Bas shows it per source. For your website, each lead provider, the phone and returning customers you see how many enquiries came in, how many got a quote and how many you won or lost.
Bas lists your largest unpaid invoices and how long customers take to pay. You see at once who still has to pay and how long each invoice has been open. Reminders can go out for you, based on the payment terms you’ve set.