
How many of last week’s quotes turned into moves? How full is the diary three weeks out? And the commercial customer who still owes you, how long has that invoice been sitting there?
If you had to think about any of those, you’re running on feel. Most owners do. You know it was a busy week with plenty of enquiries and a few good jobs. A feeling isn’t wrong, but it won’t tell you where to act.
Running a removal company on data doesn’t mean living in spreadsheets. It means looking at a handful of figures every week and knowing what you’ll do about each one.
Why bother?
Because most decisions at a removal firm come back to three questions. Is enough work coming in? Can we do it with the people and vehicles we have? Is the money actually arriving? Answer those with figures every week and you see a dip coming before it hurts.
You don’t have to collect the figures yourself. If your quotes, diary, invoices and timesheets live in one system, they come out of it on their own. In Bas, they’re on the dashboards under Insights, in real time and set against last year.
The figures worth checking every week
You don’t need to track everything. These say the most about a removal company, each with the question to ask yourself.
1. How many quotes turn into jobs?
Start with how many of your quotes go ahead. Then go past the total and break it down by source and by salesperson. Do enquiries from your own website go ahead more often than ones from lead sites and comparison sites? Does one person win far more than another? Now you know where to spend your money and your time. How to win more from the enquiries you already get is in more jobs from the same enquiries.
2. Where, and at what price, do you win?
Look at what you win by area and by price band. You might win nearly everything close to home and very little in the next town. Or do well on small moves and lose the big ones. That tells you where to be seen, and where your price might be out.
3. How full is the diary?
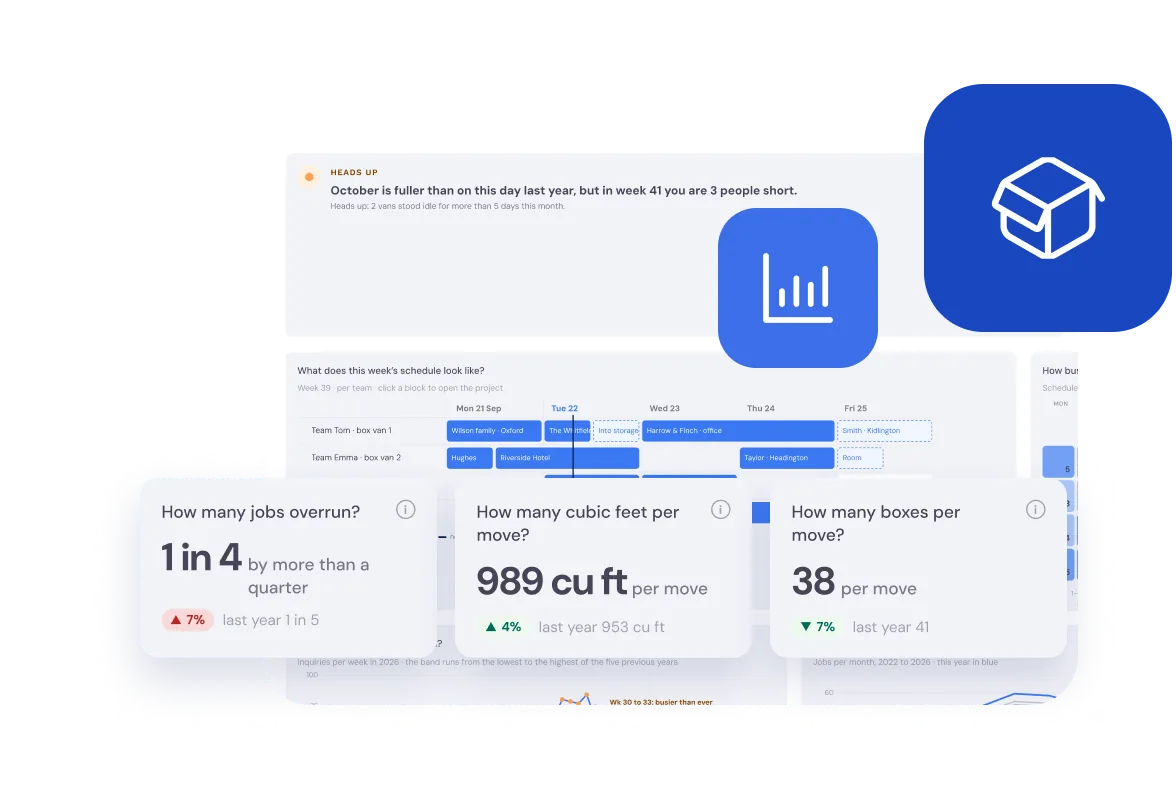
Look at how many jobs and how many cubic feet are booked for the coming weeks, and how many staff and vehicles they need. That shows whether your own crews and your casual porters are in balance, and whether there’s room for that late enquiry. More on the diary in removals planning software.
4. Is turnover heading the right way?
Compare turnover with the same period last year, not with last month. Removals is seasonal. A quiet January tells you nothing, but a January much quieter than last year’s does.
5. How much is still owed?
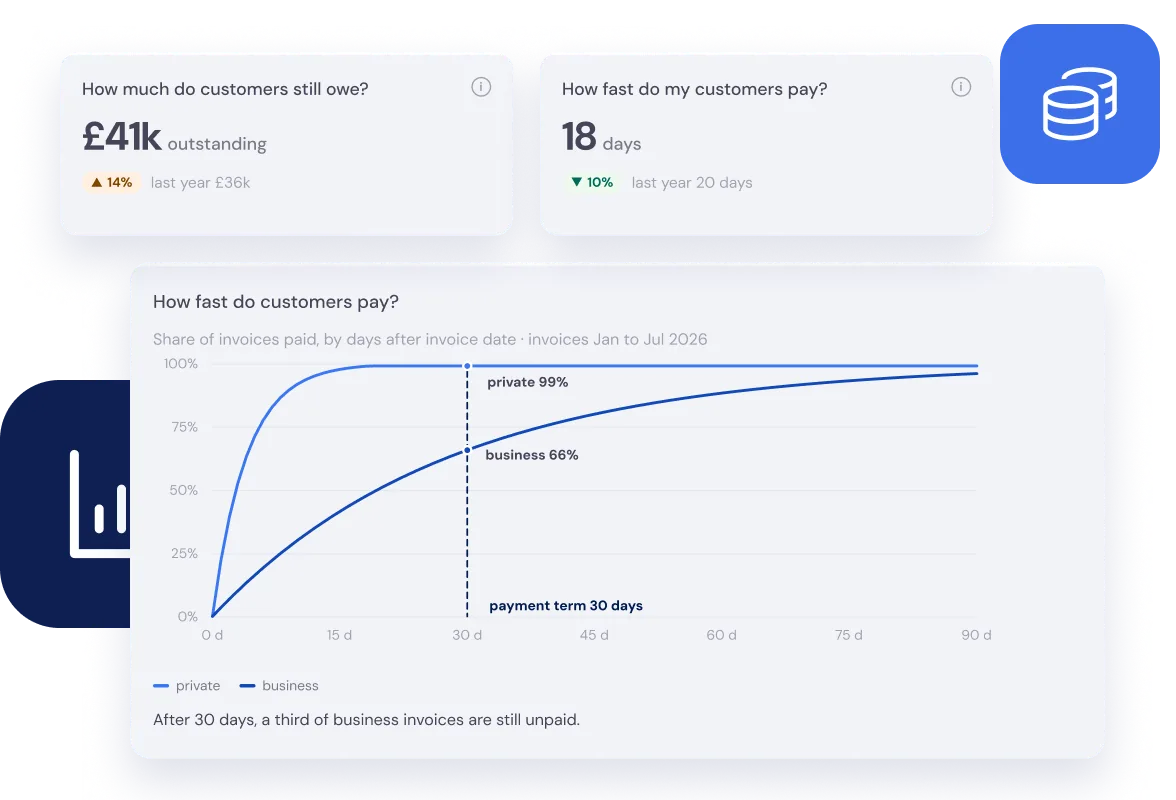
Look at your unpaid invoices and how long customers take to pay on average. A few large ones left unpaid show up in the bank straight away. Look every week and you start chasing in time.
6. How are your people doing?
Sickness per member of staff shows patterns you’d otherwise miss. Someone who’s often off for a day or two may be on the heaviest jobs too often. In Bas, everyone’s hours, sickness and jobs per week come from HR.
A figure is only worth having if you know what you’ll do when it goes the wrong way. Three figures you actually look at beat twenty you ignore.
Making it stick
Most owners start keen and drop it after a few weeks. These help:
- Pick a fixed slot. Monday morning, say, a quarter of an hour before the phones start.
- Start with three figures. Quotes that go ahead, the diary and what’s owed. Add more once it’s a habit.
- Give every figure an owner. Whoever does the quotes watches the quotes, the planner watches the diary, and you look at the whole picture.
- Share it with your staff. Five minutes in the weekly meeting is enough. People work differently when they can see what their work brings in.
- Look back after a month. What did you change, and did the figure move the right way?
When your question isn’t on the dashboard
Ask it. In Bas, you type a question about your own figures, such as how many removals you did each month this year and how much turnover they brought in, and the AI assistant answers with a table or a chart. No report builder and no formulas, just the question you actually had.
To see which dashboards come with Bas, have a look at Insights, or at Pricing for what’s included.
See last week in three figures
The dashboards an owner checks each week, from quotes won to money still owed, and what to do when one dips.
Book a demo